
Mapping on e-fauna bc

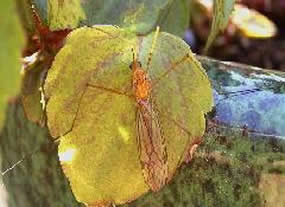
Crane Fly, photo © by Diane Williamson
INTRODUCTION
Mapping is a significant component of E-Fauna BC and helps us visualize species distributions. On E-Fauna BC, we use dynamic interactive mapping for most groups that allows users to explore species distributions using a comprehensive data set. However, we also present static maps provided by experts for some groups.
GIS Mapping: Dynamic Interactive Mapping
Dynamic interactive GIS mapping is significant in two ways.
1) A dynamic map is one that is generated at the moment of a search and this means that the maps are based upon the most up-to-date versions of available databases--that is, they are current. We update our mapping database regularly.
2) Interactive GIS maps are more than 'just maps'--they are analytical tools that allow users control over the information they wish to view. That is, instead of simply displaying distribution, the interactive maps provide users with analytical capability. The interactive map can be used to explore a species distribution using the data layers that are provided.
Key Points About Our Interactive Mapping
The data layers we provide include all available databases of distributions in BC. This includes both collections-based and observation-based databases (e.g. the UBC Spencer Entomological Collection database). These databases are listed in the data box on the left hand side of the map. Details on the databases are provided below. Note that the distribution shown on our maps is only as accurate and up-to-date as the databases we use. Each institution works to update their database and their collections identifications on an ongoing basis. New taxonomic work may or may not be reflected in a database immediately.
While the E-Fauna BC Atlas focus is on species found in BC, with our new mapping you can now view the entire world-wide distribution of all species.
LIMITATIONS OF THE MAPPING: No Dots on the Map?
Note that sometimes our distribution maps are relatively blank. This can happen for several reasons:
1) We do not presently have any BC-specific data to display for a particular species or faunal group. This can happen for one of several reasons:
2) The data provider may not yet have databased all of their collections, so some groups may not yet be represented. We will add data for species or groups as it becomes available.
3) Blank distribution maps may also occur in E-Fauna because, while there may be collections in a museum for a species from a given region, the specimens may not have precise locality information (that is, latitude and longitude) recorded. These records cannot be mapped until this information is added to the database.
4) Blank maps may also occur where specimens might be in museum collections under other names (synonyms). We will be working over time to add more synonyms to our species databases in order to 'capture' these additional collections.
To view a list of the database used in the E-Fauna mapping, visit the How to Report Map Errors page.
Please cite these pages as:
Author, date, page title. In: Klinkenberg, Brian. (Editor) 2023. E-Fauna BC: Electronic Atlas of the Fauna of British Columbia [www.efauna.bc.ca]. Department of Geography, University of British Columbia, Vancouver. [Date Accessed]
© Copyright 2023 E-Fauna BC.