
Using the Interactive Maps: Icons, Zoom Features and More
E-Flora BC's interactive web maps allow you to explore the distribution of a species and how it relates to the Biogeoclimatic Ecosystem Classification (BEC) zones, the climate, etc. of British Columbia. You can learn more about the data on our Mapping on E-Flora BC page. If you have any questions about our maps, please contact us.
To view the layers and legends and background data
When you view the full-size interactive map, two data/information boxes should appear on the right-hand side of the map. These contain 1) the layers and legends used on the map and 2) a box that allows you to display the data associated with each distribution dot (click on a distribution dot to call up the data).
If the two information boxes are not opened by default by your browser, then you will need to open them. To do this go to the icons on the top left of the map. Cursor over them until you find one labeled as 'Layers and Legends' and one labeled as 'View Record Details' (the 2nd and 3rd icons in the figure below). Click on these and the boxes will open.
![]()
General Information
The important thing about interactive maps is that you can do a lot with them. You can enlarge the maps or make them smaller by using the ZOOM feature. You can move the map around by using the PAN feature (hold your cursor down to move the map). You can retrieve data for a distribution dot by using the GET DATA feature (just click on a dot for the data to show up). The data will be displayed in the 'View Record Details' box on the right hand side of the map. You can change the base map using the SELECT A BASE MAP feature (you can switch from a regular map to a satellite map, for example). At any time, after you have made selections using our tools, you can return to the original map by hitting the REFRESH button on your computer or by using our FULL EXTENT tool, which does the same thing.
Our interactive maps show several categories of data, including distribution data and geographic data. For example, to view the data layers we use to show species distributions, go to the data layers box on the right, and click on the little box beside E-FLORA DATABASES. This opens a drop down list of databases we use. You can turn these database layers on and off by clicking on the associated checkbox. The other (geographic) data layers work the same way.
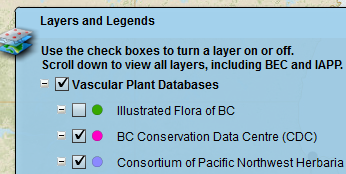
Our distribution dots are colour coded. The dots should be displayed to the left of the layer name in the Layers and Legends window (see below).
What the ICONS and symbols on the maps mean.
Placing your mouse over an icon in the web map will, in many cases, result in a text pop up telling you what the tool does.
Located along the top left edge of the map are the tools
for navigating through the map. You can also drag the little arrow
on the scale bar in the upper-left edge of the map to zoom in or out. The scroll wheel
on your mouse will do the same thing.
 Zoom
in: Click once to zoom in a little bit and recenter the map where
you clicked. If you want to zoom to a specific area, left-click &
hold the mouse button down while you drag a box with the mouse, and then release the
mouse button.
Zoom
in: Click once to zoom in a little bit and recenter the map where
you clicked. If you want to zoom to a specific area, left-click &
hold the mouse button down while you drag a box with the mouse, and then release the
mouse button. Full
Extent: This button zooms you out to the full extent of the map,
which is the entire province.
Full
Extent: This button zooms you out to the full extent of the map,
which is the entire province.
![]() Along the top of the map is where you can find additional tools for getting more details about the records shown on
the map, and for redisplaying the Layers and Legends window. You can minimize a tool with the - button located in the upper right of the window.
Along the top of the map is where you can find additional tools for getting more details about the records shown on
the map, and for redisplaying the Layers and Legends window. You can minimize a tool with the - button located in the upper right of the window.
![]() Get Data: This tool allows you to click on a record and obtain the data associated with that record. To get the record's data, click the
Get Data: This tool allows you to click on a record and obtain the data associated with that record. To get the record's data, click the ![]() button and then
click on the record you want to see details about. You can continue to click on additional records and obtain their data. If you click on the results in the Get Data window the map will zoom into the record. To clear your selection, click
the
button and then
click on the record you want to see details about. You can continue to click on additional records and obtain their data. If you click on the results in the Get Data window the map will zoom into the record. To clear your selection, click
the ![]() button. Clicking on the
button. Clicking on the ![]() on the top right of the Get Data window will bring you back to the initial window, clicking on
on the top right of the Get Data window will bring you back to the initial window, clicking on ![]() will switch back to the Get Data results.
will switch back to the Get Data results.
![]() Layers and Legends: This icon opens the Layers and Legends window and allows you to choose which layer or layers you wish to display on the map. By default, the E-Flora Databases layer
is always visible and the other layers are turned off. To view other layers, imply click the check box
Layers and Legends: This icon opens the Layers and Legends window and allows you to choose which layer or layers you wish to display on the map. By default, the E-Flora Databases layer
is always visible and the other layers are turned off. To view other layers, imply click the check box ![]() next to a layer to turn it on
next to a layer to turn it on ![]() or off
or off ![]() .
.
Clicking on the small + next to a layer will 'open' the layer and show you the sublayers it contains. Click on the boxes of the sublayers you wish to view, and these will be displayed on the map.
You can close the Layers and Legends window with the ![]() button, or minimize it with the - button.
button, or minimize it with the - button.
![]() Print:
Print the map as it currently appears in your web browser.
Print:
Print the map as it currently appears in your web browser.
![]() This is
where you control what base map is visible on the web map. There are three
base maps available (other data listed under E-Flora layers can be displayed
on top of the base map).
This is
where you control what base map is visible on the web map. There are three
base maps available (other data listed under E-Flora layers can be displayed
on top of the base map).
General
Base Map: This base map includes roads, political
boundaries, cities, major rivers and lakes, and some protected areas.
Satellite Imagery
Base Map: This base map has satellite imagery for the world
at a resolution of 15m worldwide, and 1m in the USA.
Topography Base Map: This is a simple base map of shaded
topographic relief. It is intended for use between 1:40,000,000 and
1:70,000 as the data is not visible at the global scale or when zoomed
way in (the imagery will turn off).
Help: A link to this page.
About the Data: A link to a page that describes the data used in creating the maps.
Recommended citation: Author, date, page title. In: Klinkenberg, Brian. (Editor) 2023. E-Flora BC: Electronic Atlas of the Flora of British Columbia [eflora.bc.ca]. Lab for Advanced Spatial Analysis, Department of Geography, University of British Columbia, Vancouver. [Date Accessed]
E-Flora BC: An initiative of the Spatial Data Lab, Department of Geography UBC, and the UBC Herbarium.
© Copyright 2023 E-Flora BC.